The AI Traffic dashboard is part of the Semrush Traffic & Market Toolkit, designed to reveal how competitors gain traffic from AI-powered assistants like ChatGPT, Gemini, and Copilot (full list below).
Use this dashboard to identify which domains are being recommended by popular large language models (LLMs), helping you uncover emerging sources of traffic and optimize your presence across the AI-powered web.
Getting started with the AI Traffic dashboard
The Get Started menu is your entry point into the Semrush Traffic & Market Toolkit. It’s designed to help you quickly enter domains and move into your analysis of their traffic and marketing performance.
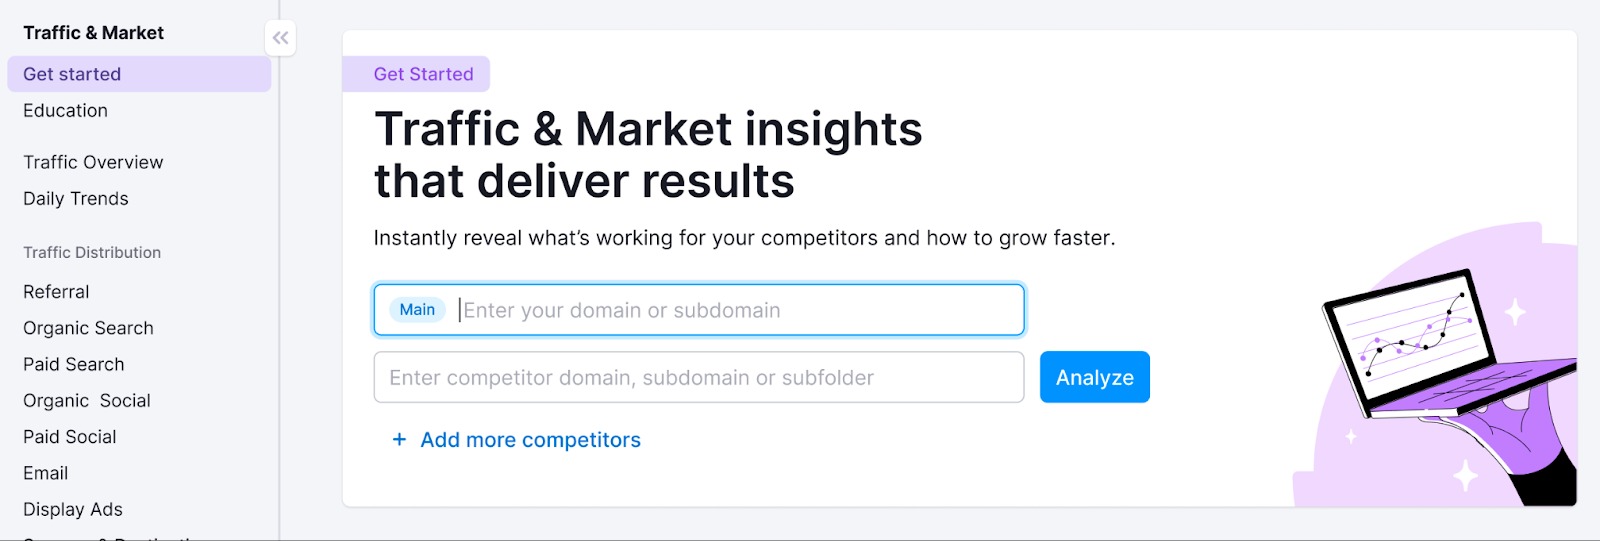
You’ll use this page to kick off your analysis—it’s your launchpad into the entire Traffic & Market experience.
If you haven’t started any analyses yet, you’ll see a search panel where you can:
- Type in a domain — Start by entering the main domain you’d like to analyze
- Add additional competitors — Use the “+ Add more competitors” link to compare multiple sites at once
- Click the "Analyze" button — This will pull up dashboards with data and charts, starting with the Traffic Analytics dashboard
If you’ve already entered domains into the toolkit, you’ll see them saved as “Folders” and you can access them anytime.
In this case, you’ll see your saved folders listed on the Get Started screen. Click any one of them to jump straight into your dashboards and pick up right where you left off.
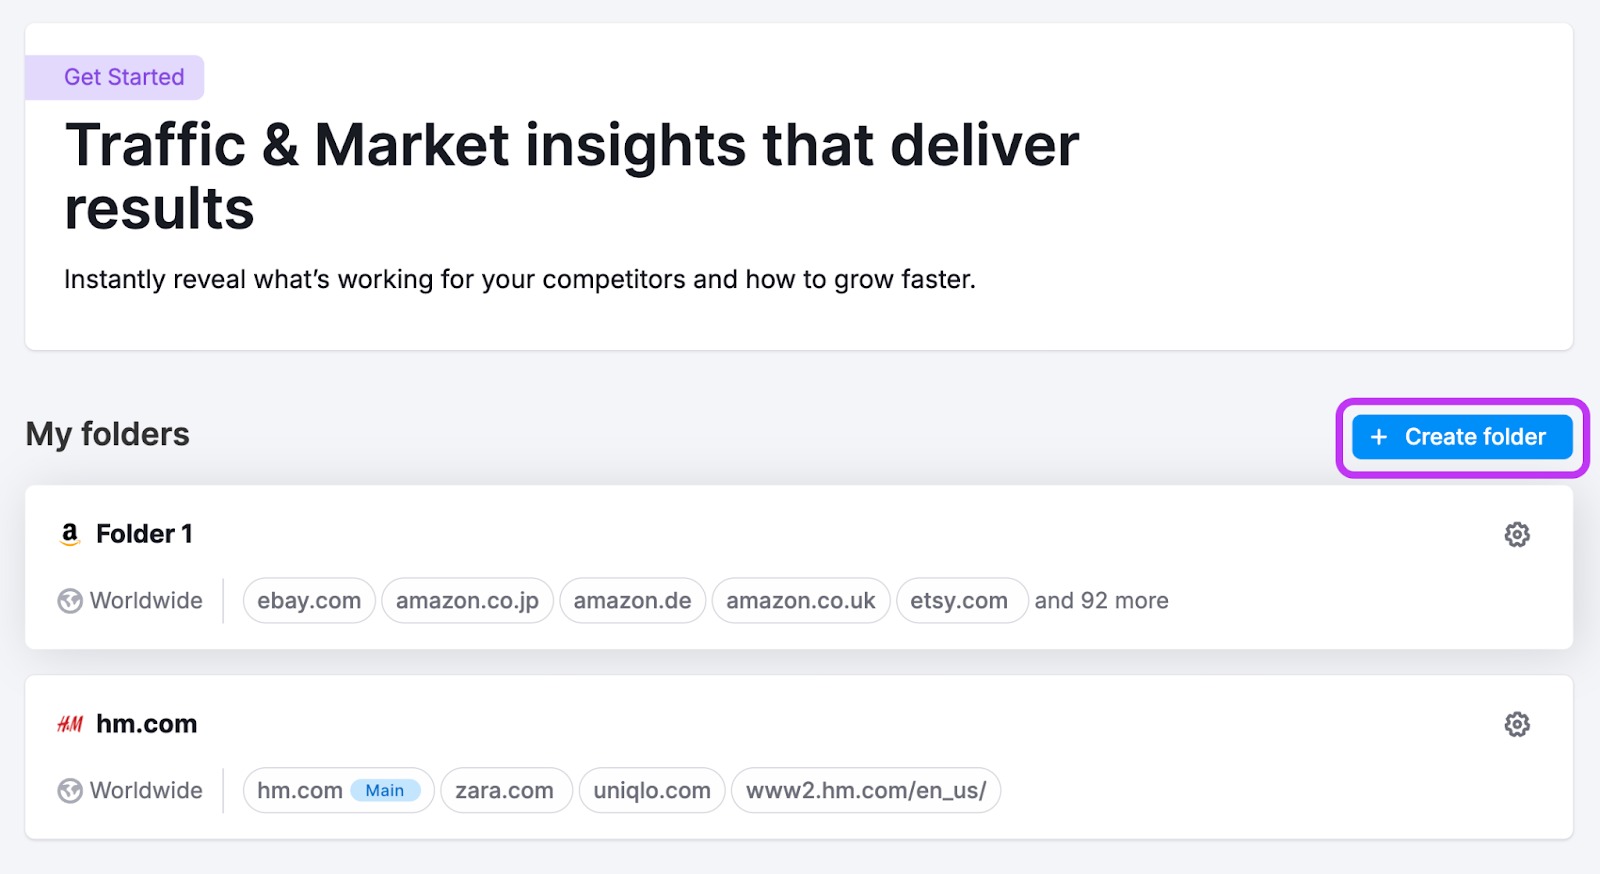
Use the “Create Folder” button to start a new project whenever you're analyzing a new domain or market.
Note: At any time inside any dashboard, you can select the Competitor list drop-down in the upper left to edit your current list or create a different one without losing your place.
How to use the AI Traffic dashboard
The AI Traffic dashboard is fully interactive and customizable, allowing you to explore LLM-driven traffic in depth. Use the filters at the top of the page to refine your view and focus on the insights that matter most.
Start by choosing your date range, data granularity (daily, weekly, or monthly), geographic location, and device type.
Next, select the AI agents you’d like to include in your analysis—for instance, ChatGPT, Copilot, Perplexity, Gemini, or DeepSeek. Once selected, your data will automatically populate across the graphs below.
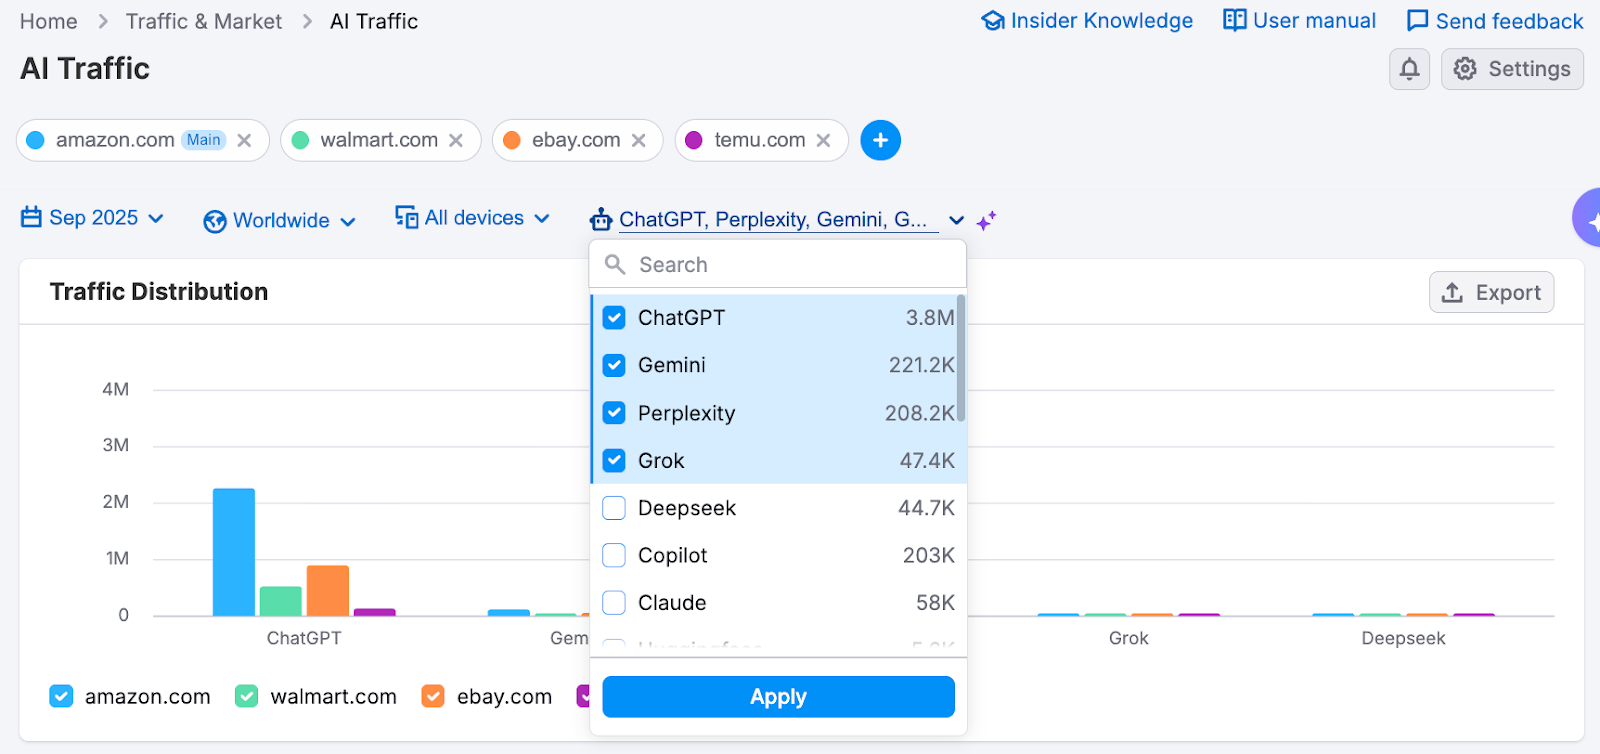
At the top of the dashboard, you’ll find the Traffic Distribution chart. This graph lets you compare AI-driven traffic volumes across multiple domains side by side.

Below that, the Traffic Trend graph displays how traffic evolves over time based on the date range and data granularity you selected. You can adjust these settings anytime from the top of the dashboard.
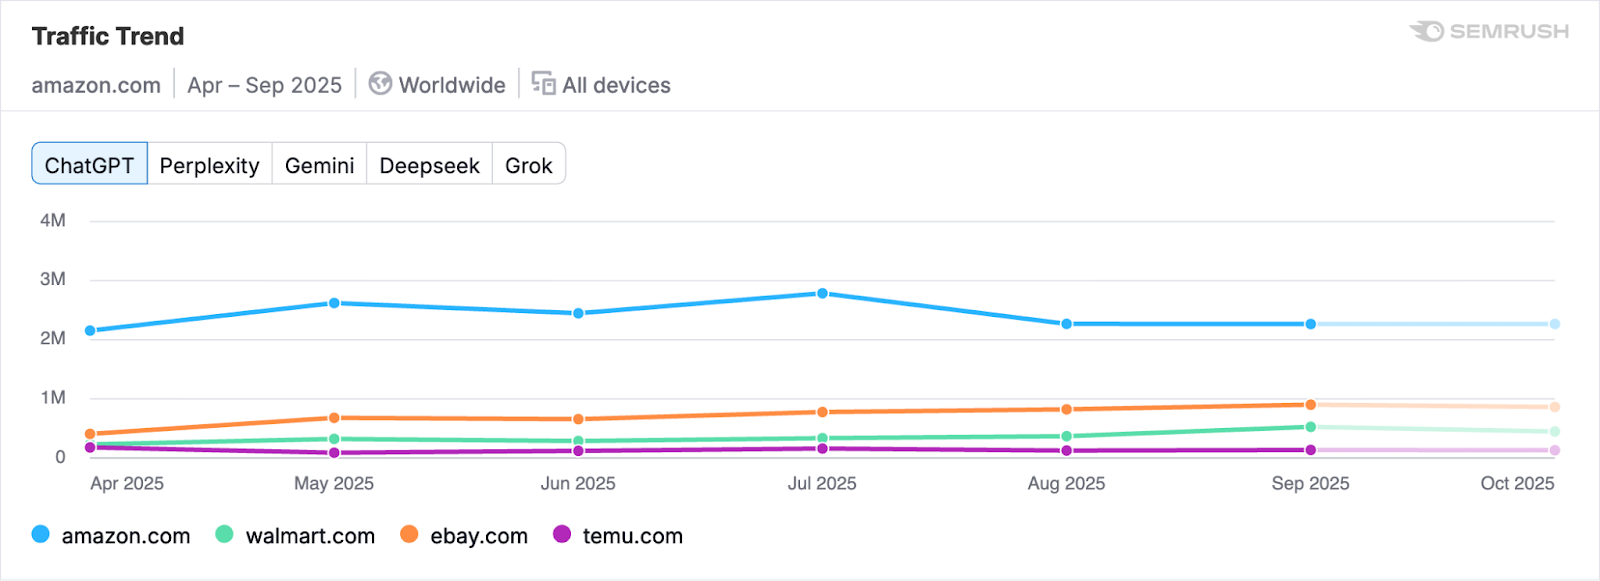
Use the tabs above the graph to switch between different AI agents, or hide specific domain lines by unchecking their boxes beneath the graph.
The Trending Pages section highlights which competitor pages are receiving the most traffic from AI agents. Switch between AI agents or competitors using the tabs at the top of the table.
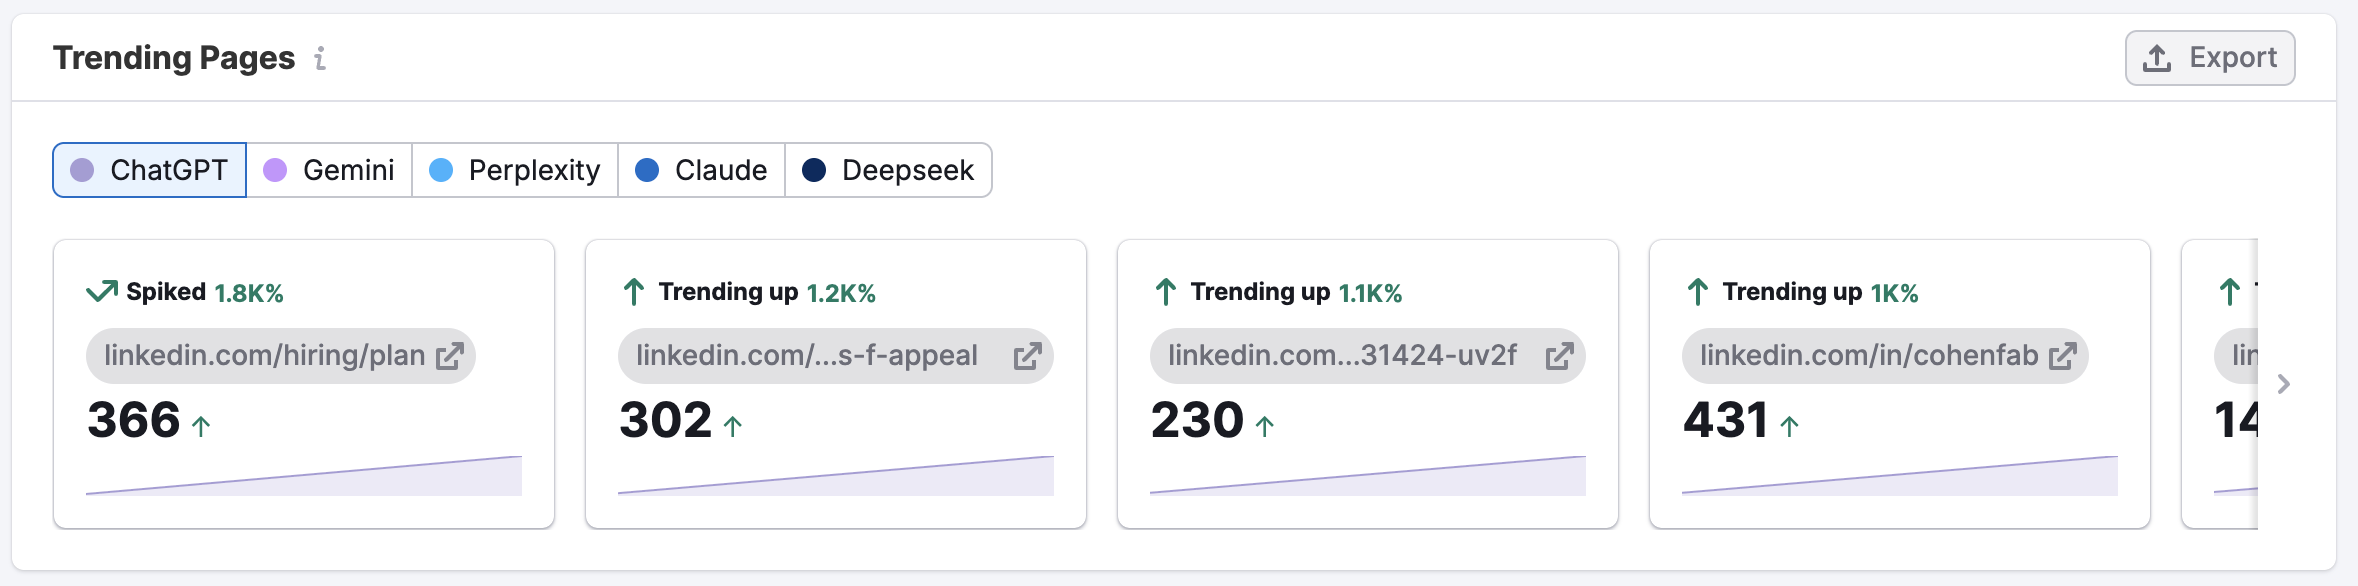
Each card shows the page URL (with a clickable link), its percentage traffic increase, and the total traffic received. Use the arrows on either side of the table to scroll through additional pages.
Finally, the All Sources table at the bottom of the dashboard provides a detailed breakdown of AI traffic sources. With this table, you can:
- Analyze AI traffic by category
- View traffic splits among your selected domains
- Compare traffic share and growth rate

Use the table filters to toggle between competitors or categories, and hover over metrics for additional details via tooltips.
This section is especially useful for:
- Identifying which LLMs drive the most traffic across competitors
- Tracking trends in AI-generated traffic growth or decline
- Benchmarking performance by time period, device, and channel segment
Which AI Assistants are being tracked?
The dashboard tracks traffic coming from a range of popular LLM-powered tools. These platforms include generative AI assistants that suggest or surface content in response to user queries, often replacing or augmenting traditional search engines. As users increasingly turn to AI tools for discovery, these sources are critical to monitor.
AI assistants tracked in this dashboard include:
- chatgpt.com
- claude.ai
- gemini.google.com
- copilot.microsoft.com
- perplexity.ai
- poe.com
- huggingface.co
- you.com
- phind.com
- pi.ai
- mistral.ai
- openrouter.ai
- deepseek.com
- jasper.ai/chat
- writesonic.com/chat
- yiyan.baidu.com
- meta.ai
- grok.com
- getliner.com
- textcortex.com
- monica.im
This list may expand as new platforms emerge. As these tools become more deeply embedded in user workflows, understanding traffic from them will be key to staying ahead of digital trends.
How can I act on the insights found in the AI Traffic Dashboard?
The AI Traffic dashboard reveals how competitors are benefiting from LLM exposure—helping you identify domains receiving AI traffic, track new discovery patterns, and adapt your SEO and content strategies accordingly.
Here’s how you can use the data:
- Spot traffic trends originating from AI assistants
- Compare AI traffic share across competitors and devices
- Identify which assistants—ChatGPT, Gemini, Copilot, and more—are driving traffic
- Monitor changes in traffic volume and share
By regularly analyzing the AI Traffic dashboard, you can position your site for better visibility in the rapidly evolving world of AI-powered discovery.
What related Traffic & Market dashboards should I use?
To get a complete picture alongside your AI traffic insights, explore these related dashboards:
- Traffic Analytics – For a high-level view of total visits, engagement metrics, and traffic sources across all channels over time
- Sources & Destinations – To understand the broader user journey, including what sites send traffic to competitors, and where those users go afterwards
- Daily Trends – To track short-term changes in traffic, engagement, and specific channels on a daily level
- Referral – To identify which websites drive traffic to your competitors via external links
- Top Pages – To analyze a site’s content structure and identify which pages attract the most visits
- Market Overview – To benchmark domain performance against competitors and view overall market trends and share
These dashboards complement the AI Traffic dashboard by offering broader insights into traffic patterns, content performance, and competitive positioning.